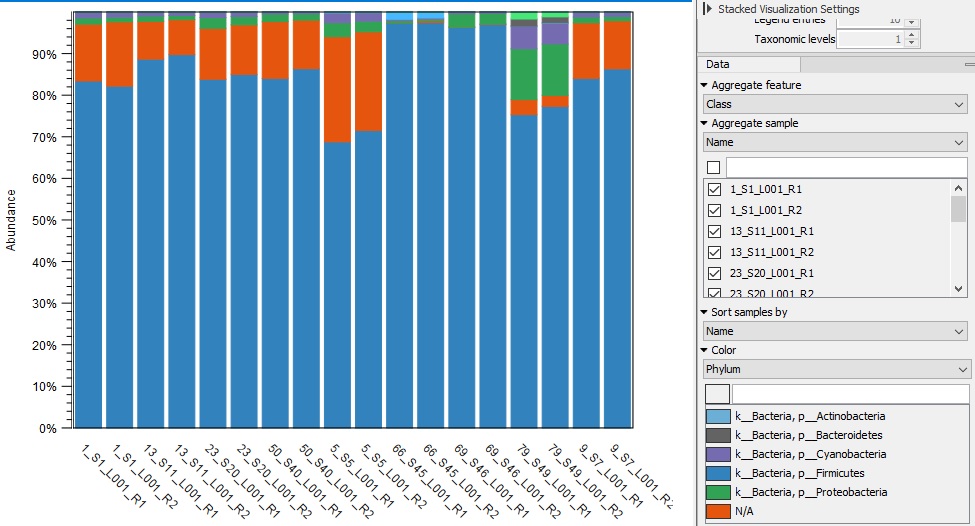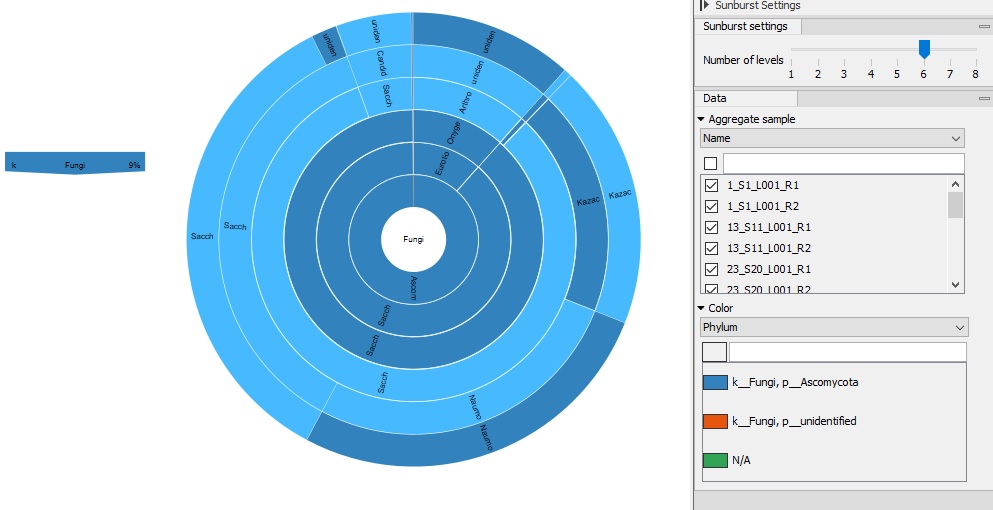

The bar graph image is the bacterial 16S analysis of the sourdough starters and the second image shows the ITS data (fungi). The first image clearly shows that the samples mostly contain a bacteria noted in blue. This blue represents Firmicutes, which includes Bacili, a major bacteria. When I ran the fungi, I noticed that 90% of the samples were from fungi not in the system, leaving them marked as unknown. This raised a lot of questions for me, because I really want to know what was present in the sample, especially at such large percentages. Overall, I do think that the various additions created a large diversity in microbiomes. I was able to isolate the control and there was only a few different bacteria and fungi types present. I isolated data for each sample and I did notice a difference in the bacteria present. This proved my hypothesis to at least be somewhat true.
Earlier the semester, the Genetics 312 class mentioned the “possibility that the cultivation of a specific type of fruit might drive the bread products made if that fruit created a hospitable environment for a particular microbe”. I was unable to reach a solid conclusion on this. Some samples had a more similar profile to the control, however, it was nothing to form a solid answer based upon. Overall, I am super excited with how the project is going and I can’t wait to do a wrap up at the end.


Comments by cebarre4