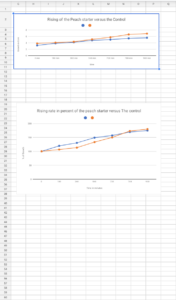
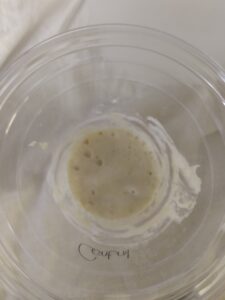
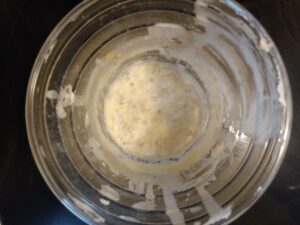
These are my graphs that tracked the rate at which my starters rose. The blue line shows the control and the orange shows the peach starter.These charts show the data that I recorded while tracking the rate that my starters were rising.This is my control after I fed it. This was my starting point when tracking my rise.This was my peach starter after I fed it. I used this as my starting point for measuring the rate of rising.

Comments by cebarre4